
Manual instrumentation
Most of the SDK is automatic instrumentation: you configure it once and it decides what to record. TracerService is the manual half. Inject it anywhere in your application to add spans inside an already-traced request, attach context to that request, capture errors you handled yourself, and report your own metrics.
import { Injectable } from '@nestjs/common';
import { TracerService } from '@nestjs/observe';

@Injectable()
export class CatsService {
  constructor(private readonly tracerService: TracerService) {}
}
ObserveModule.forRoot() registers a global module that exports TracerService, so you can inject it in any module without importing ObserveModule again. (forRootAsync() is global too, unless you pass global: false.) Every method reads the trace from the ambient async context, so calling one outside of a request, job, or other instrumented operation throws: there is no trace to attach to. This is deliberate, because a silently dropped span is harder to notice than an error. The exceptions are currentTraceId(), which returns null instead, and custom metrics, which aren't tied to a trace.
Creating spans#
createSpan(name, callback) runs the callback inside a new span nested under the currently active one, and returns a promise of the callback's return value. The span's duration is the callback's duration, so await anything you want measured:
async findOne(id: string, activeUser: ActiveUserData) {
  return this.tracerService.createSpan('cats.findOne', async (span) => {
    span.addTags({ userId: activeUser.sub, catId: id });
    return this.catsRepository.findOne(id);
  });
}
Spans nest by call stack: a createSpan() inside another createSpan() callback becomes its child, which produces the waterfall on the trace detail page. The callback may be synchronous or asynchronous. Auto-instrumented spans (controller methods, providers, database calls) and your custom spans share the same tree, so a hand-named span appears exactly where it ran relative to everything else.
The span argument is a TraceSpanDelegate. Its addTags(tags) method (or setTag(key, value) for a single entry) attaches key-value pairs to that span alone. Like the tags/setAttributes options described in SDK → Tags and custom attributes, they're searchable and shown on the span in the trace view. The difference is scope: those options cover every request, while these tags cover one span.
activeSpan() resolves to the TraceSpanDelegate of the currently active span without creating a new one. Use it to tag the enclosing span from code that didn't create it:
const span = await this.tracerService.activeSpan();
span.addTags({ cacheHit: 'false' });
It rejects if no span is active for the current trace.
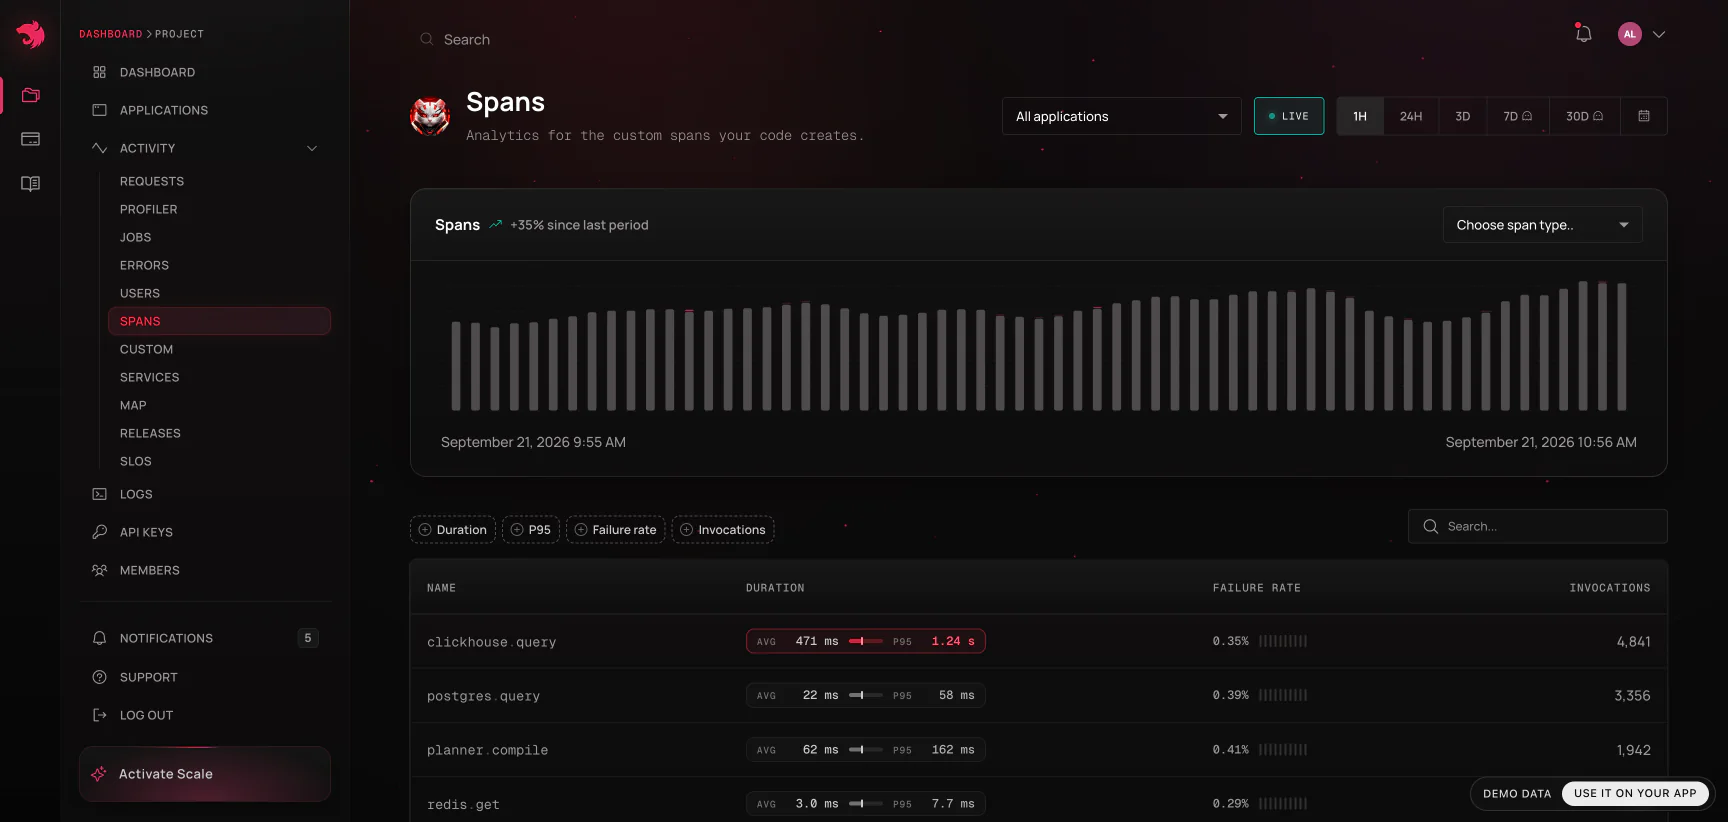
Hint The Spans analytics view aggregates by span name, across every route that calls them. Pick names that describe the work (orders.recalculate,cache.lookup) rather than the caller, so the dashboard can tell you whether something is slow everywhere or only from one endpoint.
Capturing handled errors#
Errors that propagate out of a controller, job, or span are recorded automatically. captureError() is for the ones that don't: anything you caught and handled but still want visible in the dashboard:
try {
  await this.billing.sync(accountId);
} catch (error) {
  await this.tracerService.captureError(error as Error, {
    accountId,
    retryable: 'true',
  });
}
The error is attached to the current trace, with the optional tags recorded alongside it, and gets the same source-context treatment as any other captured error if sourceContext is enabled.
Request-scoped attributes#
setAttribute(key, value) and getAttribute(key) write and read the trace's own context store. Its values live for the duration of the request and are readable from anywhere downstream, without threading them through every function signature:
this.tracerService.setAttribute('tenantId', tenant.id);
// ...later, in a different service on the same request
const tenantId = this.tracerService.getAttribute('tenantId');
getAttribute() returns undefined for a key that was never set. Both throw when called outside a traced context.
The trace id lives in the same store, so getAttribute(traceIdKey) retrieves the current trace id, e.g., to correlate with an external system or to propagate it to another service. currentTraceId() is a shorthand for that lookup with one deliberate difference: it returns null outside a traced context instead of throwing, because forwarding a trace id downstream can legitimately happen when there is no trace yet.
To type the store, pass its shape as TracerService's first type argument. Keys and values are then checked against it, including nested paths:
interface RequestStore {
  tenantId: string;
  flags: { betaCheckout: boolean };
}

@Injectable()
export class CheckoutService {
  constructor(private readonly tracerService: TracerService<RequestStore>) {}

  enableBeta() {
    this.tracerService.setAttribute('flags.betaCheckout', true);
  }
}
HintObserveModulealso exports theAsyncLocalStorageinstance that holds the trace context.setAttribute()/getAttribute()are the supported way to reach it; inject the store directly only if you need something they don't expose. If you already use the pattern described in the Async local storage recipe, this store can replace your hand-rolled one.
Custom metrics#
Three metric types are available, each created by name (or retrieved, if the name already exists). They report into the Custom section of the dashboard, and you can alert on them like any built-in metric.
Unlike the methods above, metrics aren't tied to a trace, so you can report them from anywhere, including startup and shutdown code, onModuleInit() hooks, and cron jobs.
| Method | For | Reporting method |
|---|---|---|
counter | Values that only go up - requests served, orders placed, retries attempted | increment() |
gauge | Values that go up and down - queue depth, active connections, cache ratio | increment(), decrement(), setValue(value) |
summary | Distributions you want quantiles over - latency, payload size | observe(value) |
this.tracerService
  .counter('cats.lookups', { description: 'Number of cat lookups' })
  .increment();

this.tracerService
  .gauge('cats.active.sessions', {
    kind: 'ratio',
    initialValue: 0,
    description: 'Number of active sessions',
  })
  .increment();

const latency = this.tracerService.summary('cats.lookup.duration', {
  description: 'Duration of cat lookups in milliseconds',
});
const startedAt = performance.now();
try {
  return await this.catsRepository.findOne(id);
} finally {
  // Observed in a finally so a failed lookup still lands in the distribution -
  // dropping the slow failures is how a latency summary ends up flattering itself.
  latency.observe(performance.now() - startedAt);
}
Calling counter('orders.placed') twice returns the same instance, so you don't need to hold a reference in a field, though doing so is cheaper on a hot path. Passing attributes on a later call updates the existing metric's description and labels in place.
| Attribute | Applies to | Description |
|---|---|---|
description | counter, gauge, summary | Shown alongside the metric in the dashboard. Worth setting: a bare metric name rarely explains itself to a future reader. |
labels | counter, gauge, summary | Dimensions the metric is broken down by, so the chart can be split rather than showing one aggregate line. |
initialValue | counter, gauge | Starting value. Only applied while the metric is still at 0, so a restart-time declaration doesn't clobber a value already counted. |
kind | gauge | 'ratio' (default) for values that stand alone per report, or 'additive' for values that sum across reporting instances. |
sampleSize | summary | How many observations per label are retained to compute quantiles from, which bounds the summary's memory under load. |
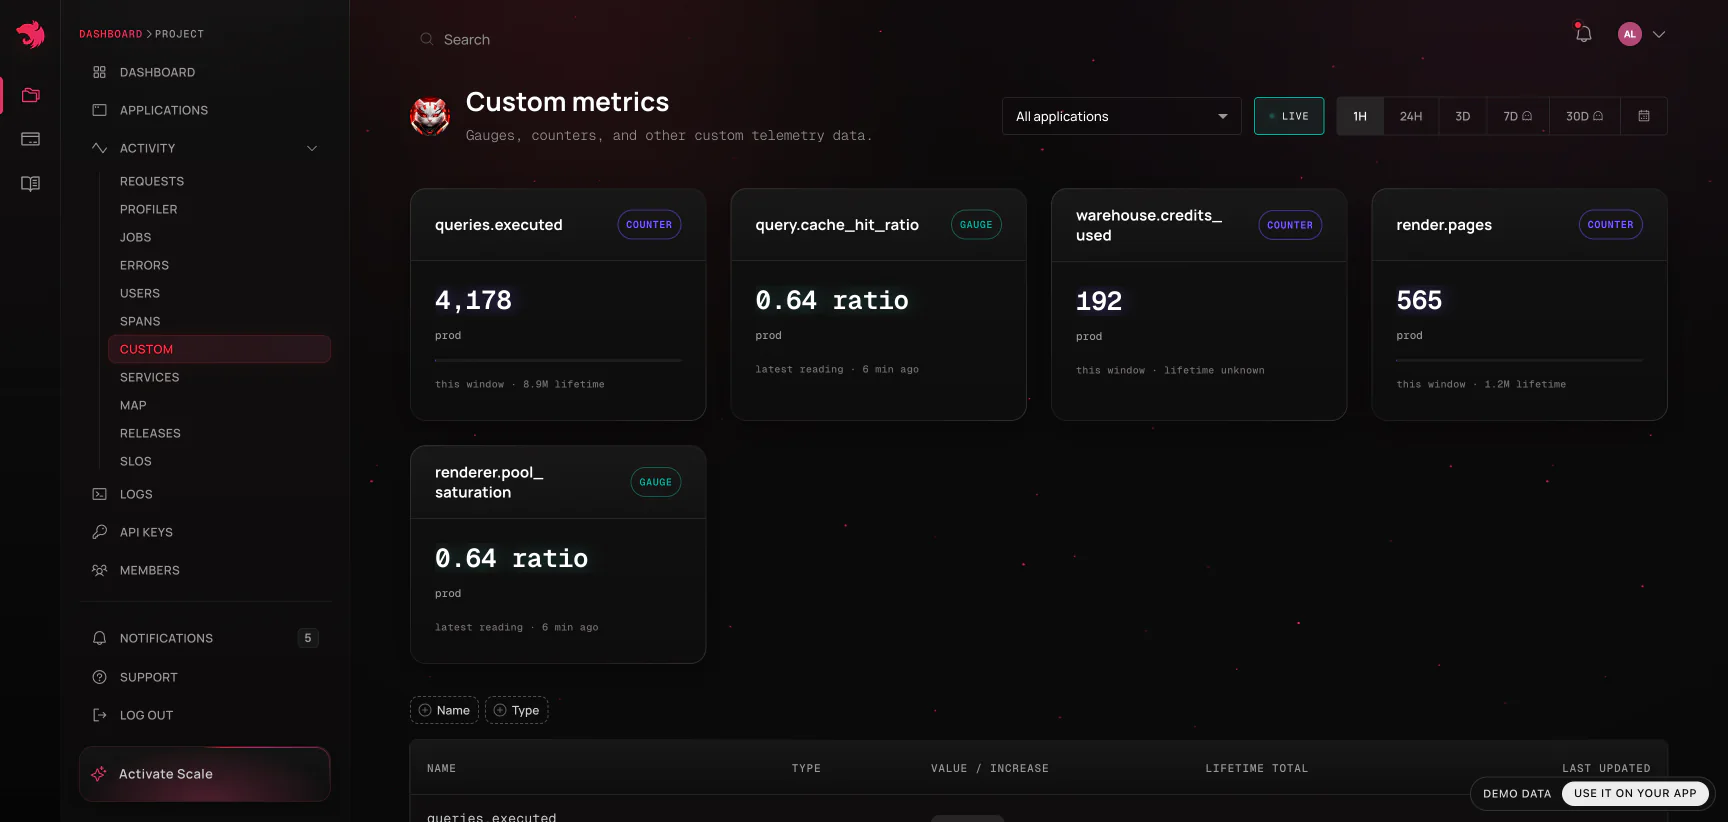
A metric that has been declared but never reported reads as "unknown" rather than 0 in the dashboard. This is a real state, not missing data: "we have never heard from this metric" and "this metric is currently zero" are different facts, and showing the second in place of the first would hide a broken deploy.
API summary#
| Method | Needs a trace | Description |
|---|---|---|
createSpan(name, callback) | ✓ | Run callback inside a new child span; returns its result |
activeSpan() | ✓ | Resolves to the TraceSpanDelegate of the span in flight |
captureError(error, tags?) | ✓ | Record a handled error on the current trace |
setAttribute(key, value) | ✓ | Write to the request-scoped context store |
getAttribute(key) | ✓ | Read from the request-scoped context store |
currentTraceId() | ✗ | The active trace id, or null outside a trace |
counter(name, attributes?) | ✗ | Get or create a monotonically increasing metric |
gauge(name, attributes?) | ✗ | Get or create a metric that can go up and down |
summary(name, attributes?) | ✗ | Get or create a distribution metric with quantiles |
Where to go next#
- Distributed tracing - use
currentTraceId()to keep one trace across service boundaries. - Dashboard - where spans, captured errors, and custom metrics show up.