
Dashboard
Once an application is instrumented and sending data, its project dashboard fills in automatically, with no queries to write and no dashboards to build. This chapter covers what each view shows, how the views relate to each other, and how the features built on top of the telemetry (alerts, SLOs, issues, and the agent handoff) fit together. For the full reference, see the NestJS Observe documentation.
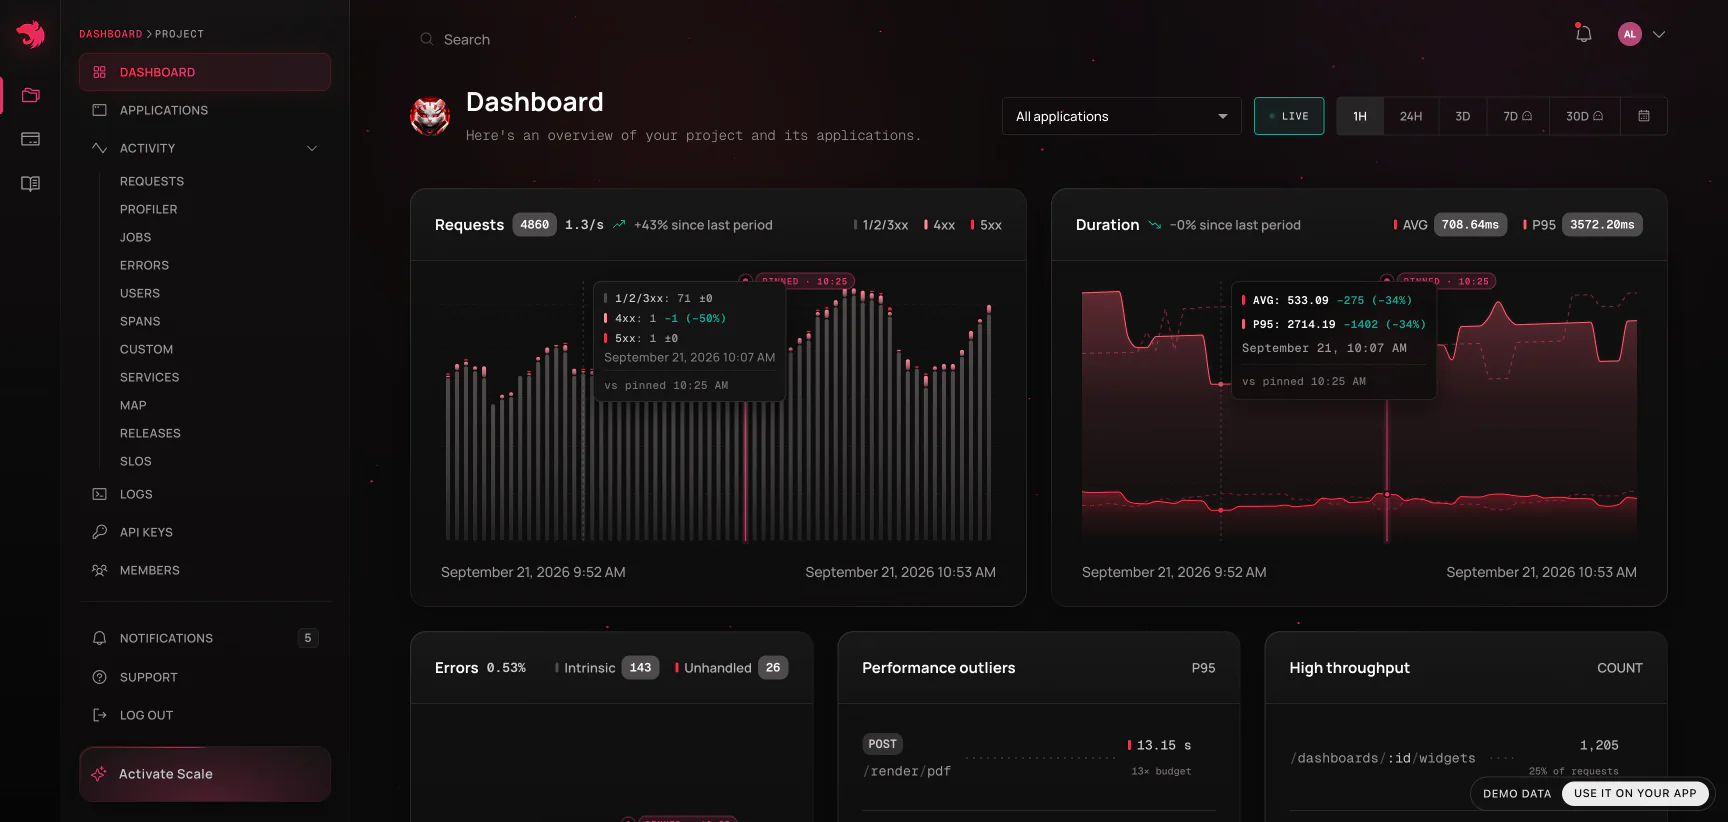
Hint Every view described below can be clicked through in the live demo, which runs the dashboard over a generated dataset from a busy service: realistic request volumes, traces with waterfalls, errors, jobs, and alerts. It needs no account and runs entirely in your browser.
How the views nest#
Almost every telemetry view belongs to one of three levels, and you move between them by clicking through:
- Analytics - the list view. Every route, job, span, or metric your applications reported in the selected window, aggregated: throughput, latency, failure rate. This is where you notice something.
- Operation - one route (
GET /orders/:id), one job name, one span name. The same numbers over time, plus the list of individual executions behind them. This is where you confirm the shape of a problem: constant or spiky, everywhere or one release. - Execution - a single request, a single job run, a single span invocation. Its exact duration, status, user, tags, the error it raised, the waterfall of everything it did, and the logs it wrote. This is where you diagnose.
Aggregates tell you that something is wrong and how much it matters; a single execution tells you why. Every view shares one control bar (a time range and an optional application filter), and everything on the page follows it.
Telemetry views#
| View | What it shows |
|---|---|
| Requests | Every HTTP, GraphQL, gRPC, microservice and WebSocket gateway request, broken down by operation. A request detail page compares the call against the route's own baseline ("slower than 95% of calls") and, when the process was struggling, states by how much host pressure slowed this operation. |
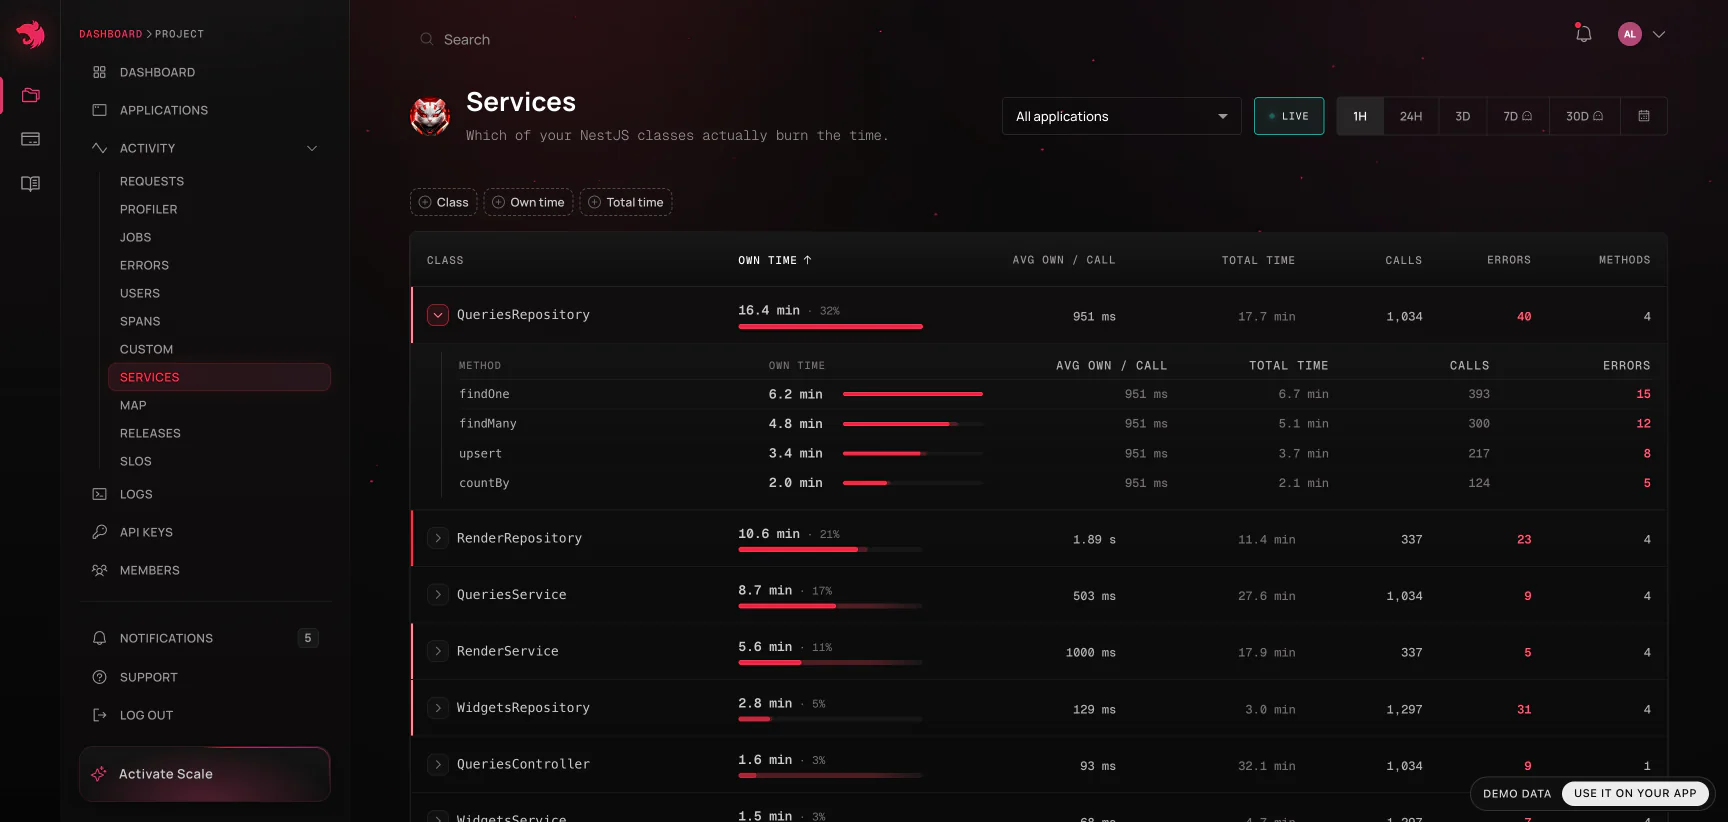
| Services | Time spent per NestJS class and method, split into own time (with everything awaited subtracted out) and total time. Only instrumented classes appear, so a short list means low coverage, not low traffic. |
| Errors | Every unhandled error, grouped by operation, with the failure leading the page: class, message, stack trace, and source code. The Group into defects switch collapses occurrences with the same class and stack shape into one fingerprinted group with first/last seen and the release that introduced it. See Error monitoring. |
| Jobs | Background work - queue consumers, cron runs - with queue wait time, attempt number, and failure reason alongside duration and failure rate. |
| Spans | Analytics over span names across every route that calls them - "how slow is OrdersService.recalculate everywhere", rather than "how slow is this one endpoint". |
| Traces | The waterfall for a trace id, across every service that shares it - see Distributed tracing. |
| Users | Per-user activity when getUserId is configured: failure rate per user, calls grouped into the actions they performed, a replay of each action, and the paths between them. A Group by customer switch rolls identities up by email domain. |
| Custom | Counters, gauges, and summaries reported through TracerService, grouped by metric name and labels. |
| Releases | Each serviceVersion compared against the one before it - error rate, latency, and throughput side by side. |
| Logs | Everything your services logged (with forwardLogs on), correlated to the traces they ran in. On an execution page, each line is placed on the trace's clock next to the span that was in flight. |
| Profiler | CPU, memory, event loop delay and utilization, and garbage collection per application, with per-instance comparison when an application runs on more than one node. Click a spike on the Memory or Event loop delay chart to see which operations ran at that moment, ranked by deviation from their baseline. |
Queries, outbound calls, and captured requests#
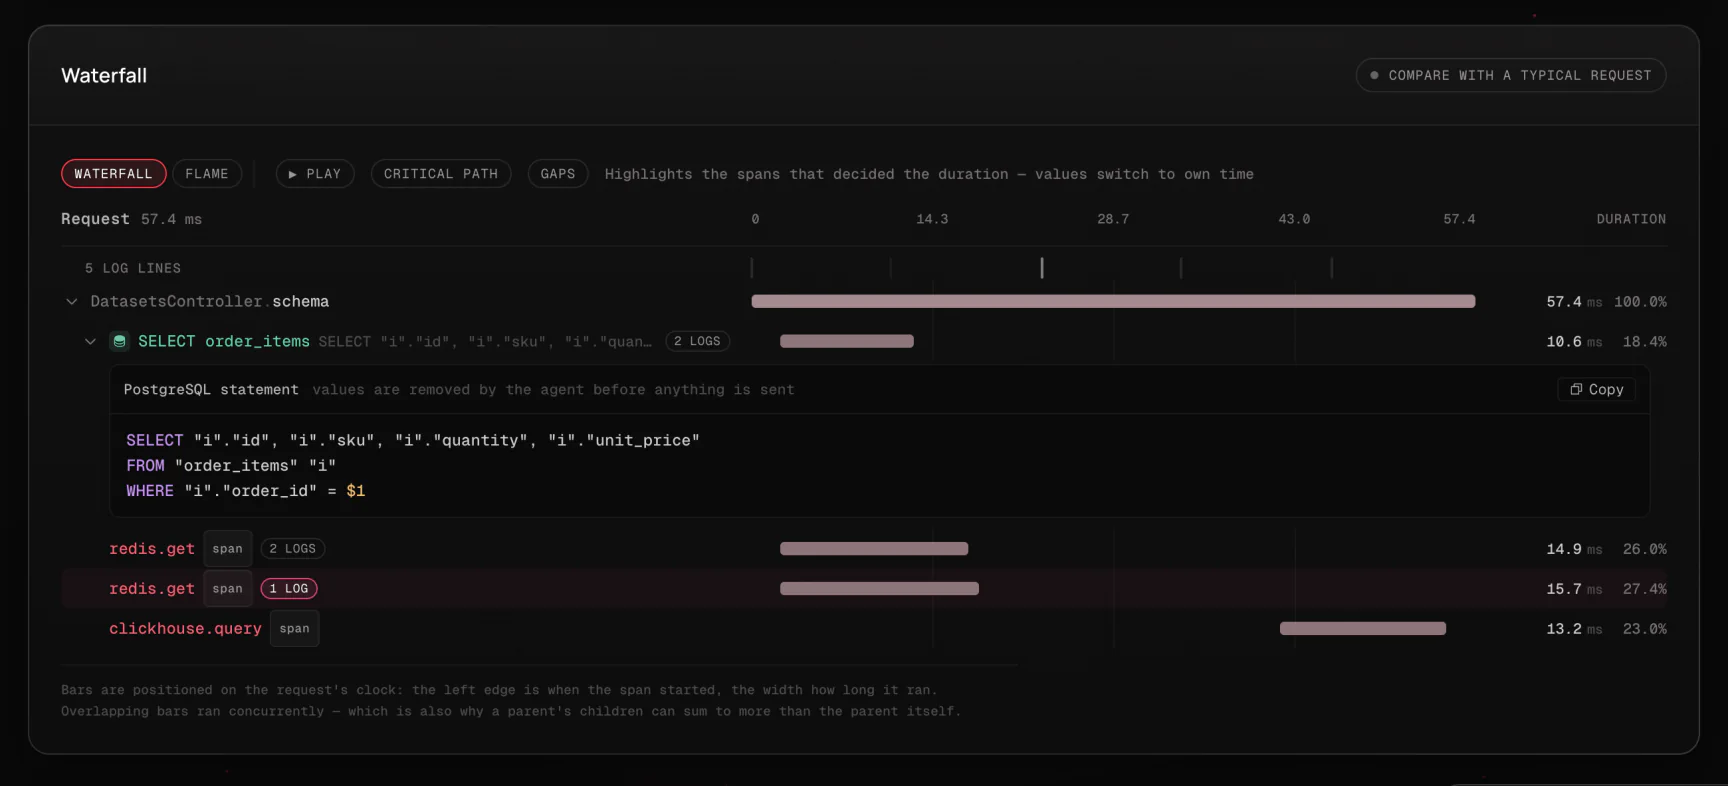
In a trace's waterfall, a database query or an outbound HTTP request is a row of its own under the method that made it: an icon, the operation (SELECT orders, POST api.stripe.com), and the statement or URL beside it, visible without hovering. The row's caret opens the full statement laid out by clause, with its placeholders highlighted and a copy button. Values never appear, because the agent removes them before anything is sent. The spans table beneath lists only your application's methods; the agent's query spans are left out and their time counts as the calling method's own, so the table still answers "which of my methods took the time". The Services page follows the same rule: drivers (pg, mysql2, mongodb, http) are not listed as classes, and a query's wait counts as the own time of the method that ran it.
When the agent kept a request's own inputs (because it failed, or ran past the slowerThanMs threshold you configured), the request's Details card has two extra folded rows, Request headers and Request body. A request with nothing captured has no such rows.
The service map#
A project's Activity → Map page shows how its applications, queues, and databases talk to each other. Applications and queues run left to right in call order, and the databases and external services each one depends on hang beneath it. A line's thickness and the speed of the traffic along it show volume. Soft red marks an error rate above 1%, full red above 5%, and teal means healthy. Hover over any node to isolate what it touches, and click it for its numbers: for a database, the statements the time went to; for an application, what it calls and what calls it, with a link to its requests.
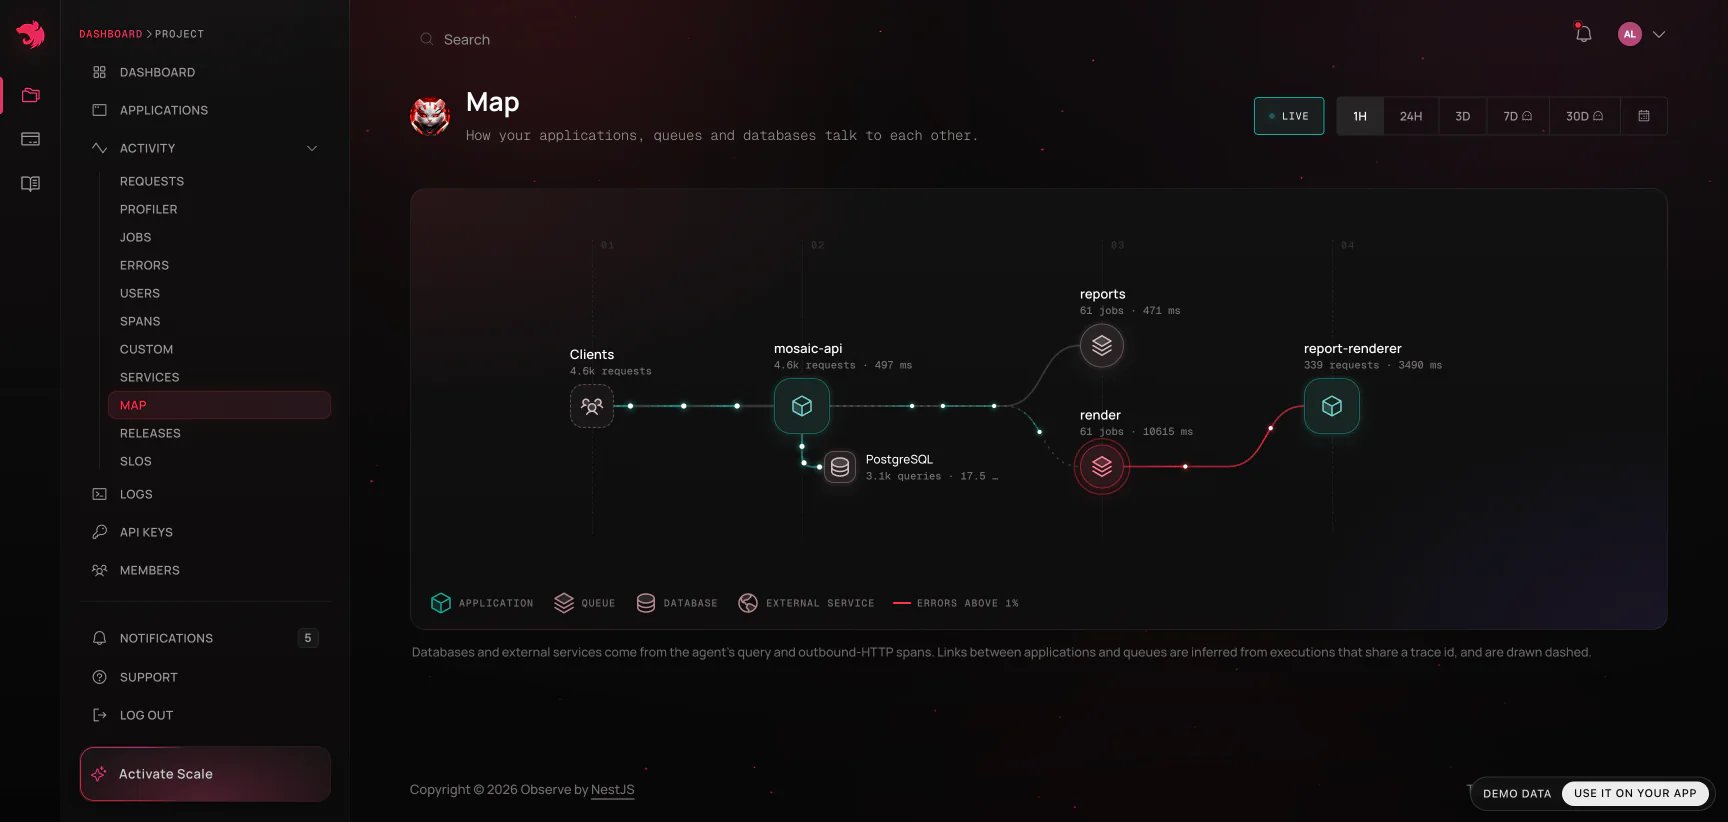
The map needs no configuration and collects nothing new. Databases and external hosts come from the agent's query and outbound-HTTP spans, queues from the jobs an application works, and the dashed lines between applications from executions that share a trace id. Each application gets one database node per driver, so two services on Postgres usually show as two databases, since nothing on the wire says they share one. An external host, by contrast, is a single node shared by every caller, up to the eight busiest per application.
An application with no lines at all is almost always running an SDK older than 0.3.0, which does not report queries or outbound calls.
Hint Links between applications are inferred from the most recent requests rather than counted over the whole window. Read a dashed line as "this calls that", not as an exact total.
Handing a failure to a coding agent#
Reading a trace tells you what happened. The next step is always the same: find that code and change it. The Copy agent prompt button does that handoff in one click. It copies the entire page as a self-contained markdown prompt, ready to paste into Claude Code, Cursor, or any other tool that has your repository open.
The button appears only where there is something to investigate: a request or job that failed or ran slower than 95% of its peers, or a trace containing an error. The prompt carries the task framing, the operation context, the error with its trimmed stack trace and source lines (paths rewritten relative to your project root, so src/orders/orders.service.ts:35 rather than /var/app/current/dist/orders/orders.service.js:35), how the call compares to the operation's average and p95, the top spans by self time, up to 40 log lines chosen errors-first, and closing instructions asking the agent to explain the root cause from the code and propose a fix as a diff with tests.
For an agent that needs to keep asking questions (follow a trace into its logs, check whether an error is still firing), connect it to the MCP server instead.
Alerts#
Alerts notify you when your telemetry crosses a threshold you care about, so you don't find out from a customer. A rule watches one metric from one of these families:
| Family | Metrics | Scoped to |
|---|---|---|
| Request | Error rate, p95 latency, avg latency, throughput | An application, and optionally one route + method |
| Job | Job failure rate, job throughput, p95 queue wait | An application, and optionally one job name + queue |
| Absence | Telemetry silence, job silence | An application, or one job name + queue |
| Logs | Matching log lines | A pattern, and optionally levels + logger context |
| Errors | New error groups | An application, or the whole project |
| Runtime | Event loop delay, CPU usage, memory usage | An application (sampled per process) |
| Custom | Any custom metric your application reports | A metric name, and optionally one label |
| SLO | SLO burn rate | The SLO itself |
Every rule runs in one of two modes: a fixed threshold ("error rate above 5%"), or anomaly detection, which fires when the metric deviates from its own recent baseline by more than a sensitivity you set. Anomaly mode is often the better choice for runtime metrics: a fixed CPU threshold that's right for one service is wrong for the next, but "unlike its own recent baseline" applies to both.
Two families depend directly on SDK instrumentation:
- Absence detection. A Telemetry silence rule watches the runtime heartbeat the SDK's
runtimeMetricssampler emits even when the application is otherwise idle, and fires once it has been silent longer than a tolerance you set (2 minutes to 7 days). A Job silence rule does the same for one named job, e.g., a cron that didn't run. The same mechanism gives you both lightweight uptime monitoring without an external probe and cron monitoring. A scope that has never reported anything doesn't fire: "not yet integrated" isn't "down". - Log-pattern alerts count log lines containing a substring within the window ("alert me when
payment declinedappears more than 10 times in 15 minutes"), and requireforwardLogsto be on.
A rule can notify through email, Slack (incoming webhook), a generic webhook, an in-app notification, or by creating an issue pre-filled with the rule's severity and scope. Rules can carry a recurring mute schedule for quiet hours, and every state transition (OK → Firing → Resolved) is recorded with per-channel delivery status.
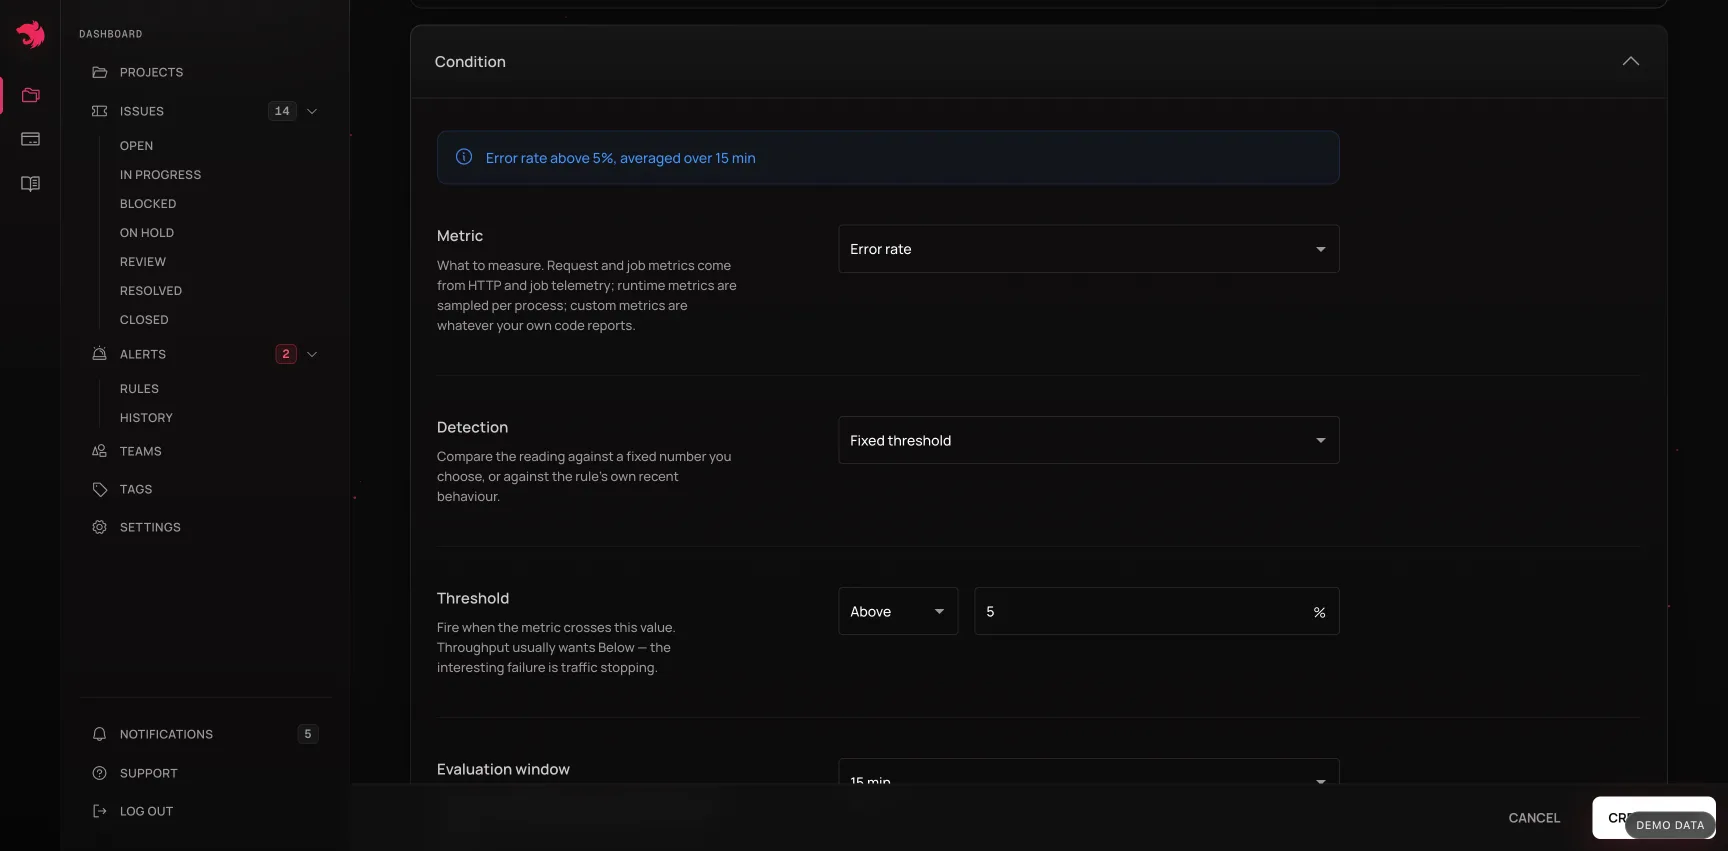
New errors. A new error groups rule fires when an error Observe has never seen before appears. It counts unhandled failures only: a group whose first occurrence answered with a 5xx, or failed on an entry point with no HTTP status (an RPC handler, a gateway message). An error your code threw on purpose, such as a NotFoundException or a failed validation, still appears in the Errors view but doesn't count as a new bug. Every plan, Free included, also gets a built-in new-error email without creating a rule: one email per project listing the new errors, at most six a day. Each person can switch it off under Settings → New error emails.
SLOs#
SLOs turn "error rate above 5%" into "we promised 99.9% and we're spending the budget too fast". They're objectives over telemetry you already collect, so no new instrumentation is required. An SLO is built from three layered concepts:
- SLI (service level indicator): a ratio of good events to total events over a window, measuring availability (requests without an unhandled error), latency (requests under a threshold you set), or job success.
- Objective: the SLI plus a target percentage (90-99.999%) over a rolling compliance window of 7, 14, 28, or 30 days.
- Error budget: how much room you have to miss the target (
1 − target), and burn rate, how fast that budget is being spent. A burn rate of 1.0 spends it exactly on schedule; 14.4 means a 28-day budget would be gone in about two days.
A burn-rate alert is a regular alert rule pointed at an SLO instead of a raw metric. Typical starting points are a fast-burn rule (1 hour window, 14.4×), a slow-burn rule (6 hours, 6×), and a trickle rule (3 days, 1×). A compliance window can't exceed how long your plan retains telemetry.
Issues#
Issues are lightweight, project-scoped tracking for the work that comes out of your telemetry, such as a recurring error worth fixing or a latency regression to investigate. Create them by hand from any execution page, promote an error group into one, or let a firing alert open one automatically. An issue links to the request, error, job, or trace it came from, so anyone opening it later has the telemetry in context, not only a description of it.
When you mark an issue resolved and it names something measurable (an operation, an alert rule's scope), the dashboard watches that operation's telemetry against its pre-incident baseline and tells you whether the fix held. It moves the issue to Verifying, then either closes it on its own or moves it back to Open with the reading that broke it. If you name the release the fix shipped in (your serviceVersion), verification waits until that release shows up in telemetry.
A worked path through the dashboard#
The views are designed to be used in order. A typical investigation:
- An alert fires, or the Requests chart shows p95 climbing.
- Sort the route list by duration or failure rate to find which operation moved.
- Open the operation. Is it constant or spiky? Did it start at a deploy? Check Releases.
- Open a single execution from the tail of the distribution, e.g., one the baseline card calls slower than 95% of calls.
- Read the waterfall: which span holds the self time?
- If it failed, read the error card - stack trace and the source lines around the throw.
- Check the logs for that trace, hovering lines to line them up with the spans.
- Copy the agent prompt and hand the whole thing to a coding agent, or open an issue linked to the execution so whoever picks it up starts where you stopped.
The same path is available to an agent over the MCP server, one tool per step, when you'd rather ask questions than click through views.